1. Market Performance: Early 2026 Review
The first two weeks of 2026 have seen silver outperform nearly all major asset classes.
•Year-to-Date Gains: Building on a stellar 150% gain in 2025, silver has surged an additional 22% YTD.
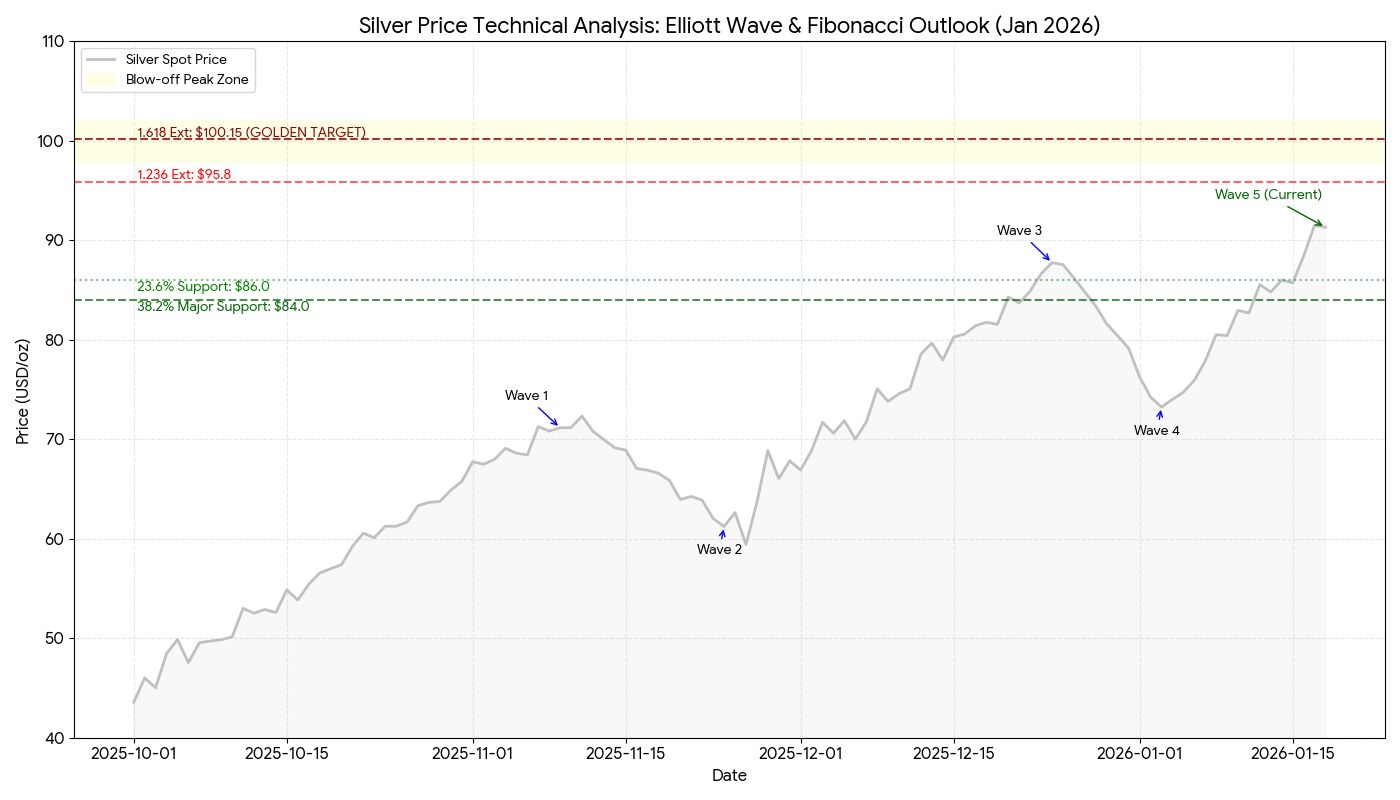
•Record Highs: After a brief dip to $74 during index rebalancing, the metal touched a new all-time high of $93.12 on January 14.
•Gold/Silver Ratio: Silver is outperforming gold by a factor of 4:1, dropping the ratio to a decade-low of 50.
2. Structural Drivers of the Surge
A. Global Inventory Squeeze
A systemic "drain" is occurring across the three primary trading hubs:
•COMEX: Registered stocks are at a critical 28M oz, while delivery demands for the March contract exceed 500M oz.
•LBMA (London): Over 85% of holdings are held by ETFs and private wealth, leaving the physical "float" for industrial clearing dangerously thin.
•Shanghai (SGE): SGE premiums have ballooned to +$10/oz over London spot, signaling an acute localized shortage in Asia.
B. ETF "HODL" Mentality
Contrary to previous rallies, ETF investors are not selling into the current strength.
•Stability: Holdings in SLV, SIVR, and PSLV remain stable, with only a small net outflow of roughly $300 million.
•Market Impact: This "HODL" mentality is removing the primary liquidity buffer that traditionally dampens price spikes.
C. Policy Pivot: The "Tariff Floor"
On January 15, President Trump postponed new percentage-based tariffs on processed critical minerals (including silver).
•Market Reaction: Silver initially plunged to a low of $86.25, but the dip was aggressively bought back to $91.68 by Friday's close.
•Psychological Safety Net: The administration's proposal of "Price Floors" to protect domestic miners signaled that the US government values silver at high prices. Traders now interpret this as a fundamental price floor.
3. The BCOM Rebalancing Paradox
Typically, the Bloomberg Commodity Index (BCOM) rebalancing in early January triggers heavy selling of previous winners.
•The Absorption: While an estimated $7.1B of silver was slated for sale, new buyers immediately absorbed the volume.
•Modest Net Change: Index funds sold roughly 13,000 contracts, but net open interest only fell by about 4,000. This highlights that the physical squeeze remains the predominant force driving prices.
4. Technical Outlook: The Path to $100
•Elliott Wave Count: We are in the terminal Sub-wave v of Major Wave III, the "blow-off" stage.
•Golden Target: The 1.618 Fibonacci Extension projects a target of $100.15.
•Critical Support: The "Line in the Sand" for the bull market is $84.00.
•RSI Warning: The RSI is near 88, signaling the market is "historically overbought". Expect high volatility near the $100 level.
Conclusion
The combination of China's export ban and the COMEX inventory drain has created a "perfect storm". While the RSI suggests a cooling period is due, the fundamental scarcity suggests any dip toward $84–$86 will be aggressively bought.